Every site in a national rollout, on one map
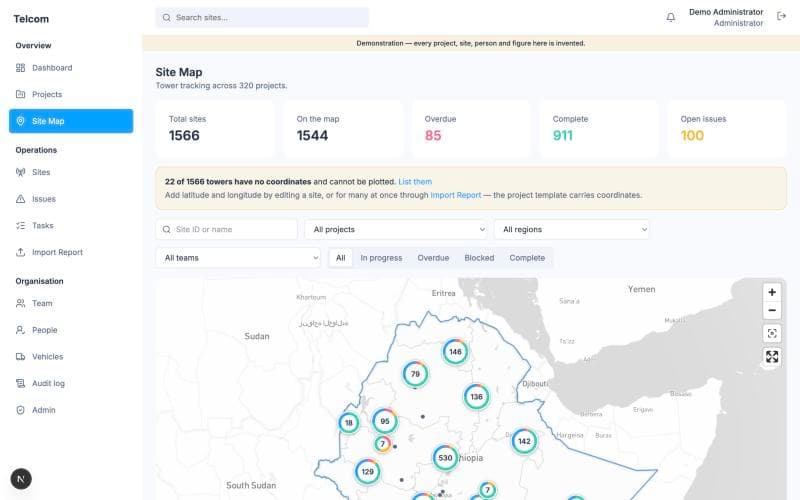
A telecom rollout subcontractor was running its build programme out of workbooks that only reconciled at month end. Now its crews record progress against plan the day it happens, and head office sees the whole country on one screen.
- Status
- Live · in daily use
- Client
- Rollout subcontractor
- Sector
- Telecommunications
- Year
- 2026
Built with
- Next.js 16
- PostgreSQL
- Mapbox GL
- Web Push
- cPanel / Passenger
Disciplines
- Product Strategy
- Platform Engineering
- Geospatial Interfaces
- Data Migration
- Multi-tenant Architecture
A project-management platform for telecom site rollout. Tracks every site through its build stages, milestones planned against actual, blockers, tasks, crews, vehicles and microwave links, on a map of Ethiopia.
Telecom rollout is a programme-management problem wearing an engineering costume. The hard part is not raising a mast; it is knowing, on any given Tuesday, which of several hundred sites is blocked, who is blocking it, and whether the date promised to the operator still holds.
The challenge
The client tracked its programme the way most subcontractors do: a daily report workbook, the operator's own assignment sheet, the vendor's project tracker, and a separate sheet for rural sites. Four files, four shapes, four people maintaining them. The numbers only agreed at month end, and by then a slipped milestone was history rather than something anyone could act on.
The approach
We did not ask them to stop using their workbooks. Asking a working team to abandon the artefact their whole process runs on is how internal tools die. Instead we wrote an importer for each of the four, so the sheets stay the way they are and the platform reads them. One of them had to learn that the operator spells the company two different ways, and that a microwave link is one site named Tx-Rx rather than two sites joined together — the sort of detail that decides whether a tool is trusted or quietly worked around.
The build
Twenty-five screens over twenty-four tables: sites and their stages, milestones as planned against actual, blockers, tasks, crews, vehicles, microwave links, comments, and a full audit trail. Roles and regional permissions decide who sees what. A map of Ethiopia carries the programme geographically, which is how the people running it already think about it. Push notifications fire when a site someone owns changes, so the tool reaches them rather than waiting to be opened.
It is built as a platform rather than a one-off. One repository, one codebase; a customer is a deployment of it — its own address, its own database, its own settings — not a copy of the source. Customer-specific importers ship with the rest and stay switched off for everyone who has not asked for them.
Where it stands
Live, and in daily use by the client's team. A demonstration instance runs on invented data so the platform can be shown without exposing anyone's programme.
Start now. Be live in weeks
One conversation, a straight assessment, and a written scope you own whether or not you build it with us.